Published on: 04/09/2025
We are proud to announce the release of RF-DAP version 2025.1! This release brings several enhancements, new features, and bug fixes to improve your experience. Check out the new features for Catalogue, Special Core Analysis Simulator (SCAS), Fluid Analysis and Simulation Environment (FASE), and Simulation of Thermodynamic Electrolyte Partitioning and Speciation (STEPS) modules.
Managing samples just got easier! The new Samples Dashboard offers a powerful and centralized view of all samples and subsamples, allowing instant access to every Experiment and Simulation performed, providing you with improved efficiency and organization, as demonstrated in Figure 1.

Figure 1 – Centralized view of samples and experiments with Samples Dashboard
Meanwhile, the Rock Subsample Requisition feature streamlines the requisition process, enhancing traceability and control over rock subsamples to ensure a more structured and transparent workflow, as shown in Figure 2.

Figure 2 – Streamlined rock subsample requisition
The new Fractional Flow, Pressure Drop, and Produced Volumes plot feature enables detailed analysis of pressure variations, breakthrough behavior, and injection performance, providing deeper insights into experimental and simulation data, as demonstrated in Figure 3.

Figure 3 – Visualization of pressure variations and injection performance with Fractional Flow, Pressure Drop, and Produced Volumes plot
Additionally, you can now download all core flooding results in a single step, exporting both experimental and simulation data as an Excel file for seamless analysis and reporting, as shown in Figure 4.

Figure 4 – Easy export of core flooding data to Excel
Now you can add heavy components to the injected gas composition in Swelling Test Injection Gas, providing you with more accurate and realistic swelling test simulations, as demonstrated in Figure 5.

Figure 5 – Adding heavy components to swelling test injection gas composition
In addition, you can now use the Specific Gravity approach to manually tune fluid models, using Specific Gravity as an alternative to Volume Translation Factor adjustments, as shown in Figure 6. By tuning a parameter with clear physical meaning, it’s easier to interpret the final tuned value and perform quality checks on the results.

Figure 6 – Manual Tuning using Specific Gravity
You can also now select the correlation used for estimating critical properties. Choose between Riazi and Daubert, Kesler and Lee, Pedersen Light Oil, and Pedersen Heavy Oil, all directly from the Setup page, as shown in Figure 7. This provides more control and adaptability to different fluid types.
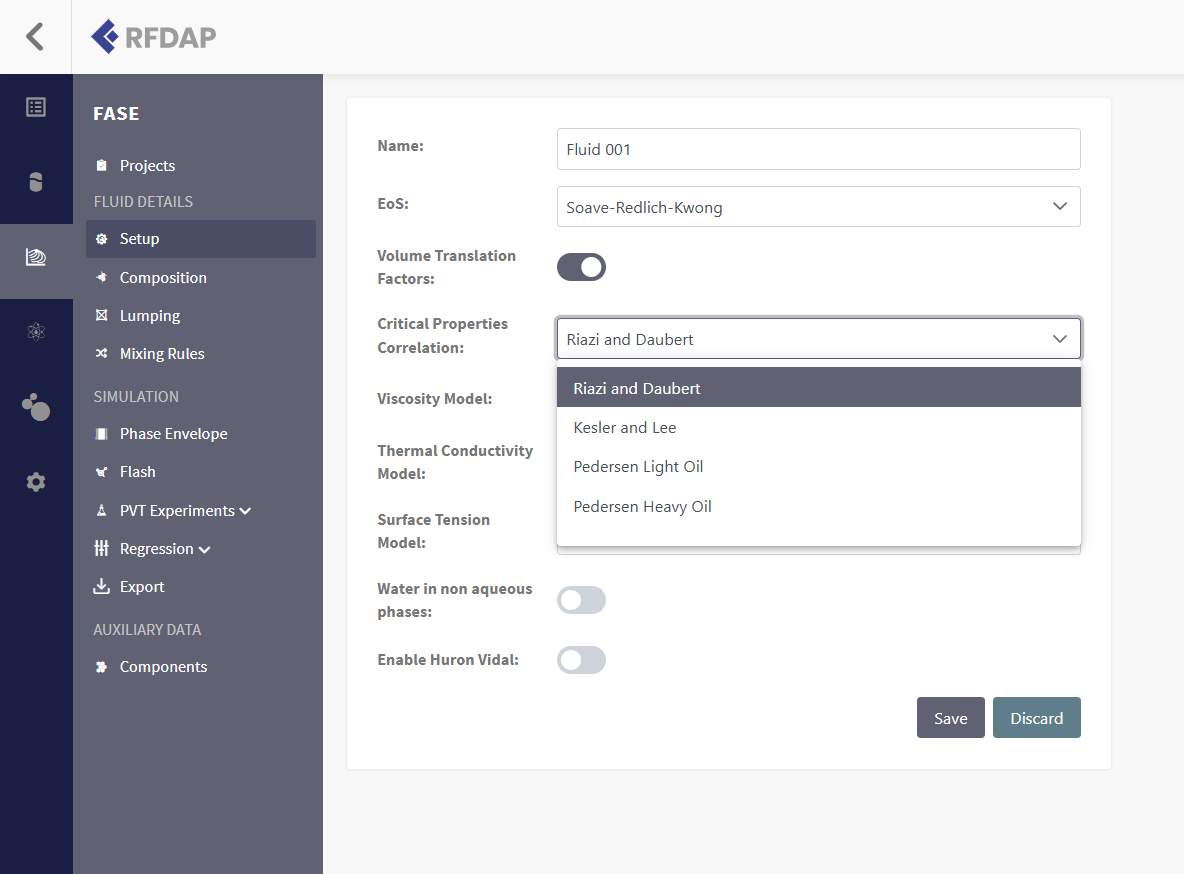
Figure 7 – Critical properties correlation selection
The latest update also brings significant improvements to the Phase Envelope and Automatic Regression modules. Now, the critical point (pressure and temperature) is included in exported Phase Envelope data, while the Automatic Regression page has been enhanced for better stability and consistency.
Finally, new IPM-Prosper Export options allow you to easily export data in both Black-Oil and Compositional formats, ensuring seamless integration with IPM software, as shown in Figure 8.

Figure 8 – New export options for IPM-Prosper formats
Managing your chemical system before equilibrium calculations just got more powerful! The new Enhanced Speciation feature allows you to suppress secondary species in equilibrium studies, providing more control over chemical species generated in each phase, as demonstrated in Figure 9.

Figure 9 – Suppress secondary species in equilibrium studies using Enhanced Speciation
The Create New Stream from Equilibrium Calculation feature lets you define new streams directly from both single-point equilibrium and survey-based results, streamlining the workflow for accurate data generation, as shown in Figure 10.

Figure 10 – Creating new streams from equilibrium results
For improved data visualization, Table View in Survey Results now allows you to toggle between plot and table views, giving you more flexibility in how survey data is presented, as demonstrated in Figure 11.

Figure 11 – Toggle between plot and table views for survey results
Additionally, with the new Export for Survey Results feature, you can now export survey results directly to an Excel file, with structured data for each survey point and properties of interest, making data analysis and reporting even easier.
FASE
– Gas Composition in Differential Liberation is now saved correctly
– Swelling test divergency problems are fixed
STEPS
– Scientific notation is fixed in the Charge Balance screen
– Edit option for streams is now working
FASE
– Removed sort from Reference Parameter and Reference Correction Factor in tuning configuration
– Regression setup now respects selected experiments
STEPS
– Fixed instability in Survey by pH
– Export for surveys in Study is now working
SCAS
– Disabled Kr Model edition after creating the simulation
– Removed Injected and Displaced Fluid labels
– Fixed simulation page responsiveness issues
– Saturation profiles plot now respects gradient legend color for time values
